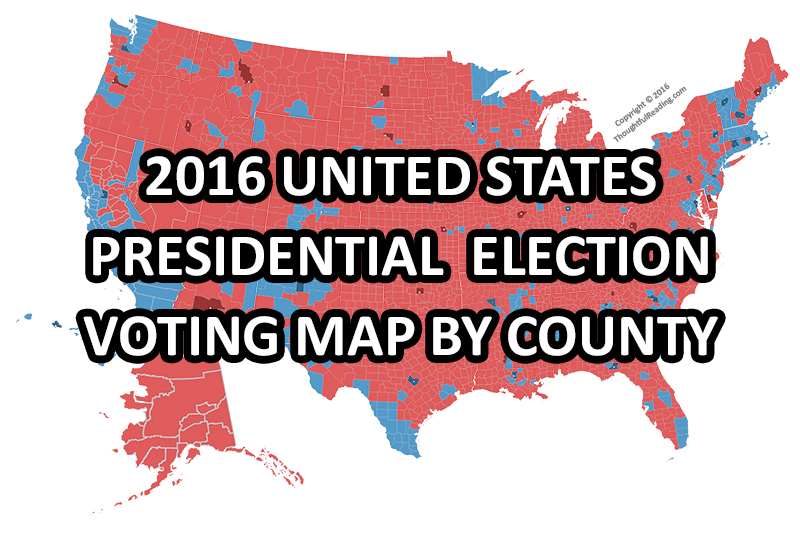
Here is the full United States voting map that I compiled because I could not find a full 2016 voters map by county, as there probably is not one anywhere yet.
I retrieved this data from the Fox News Website, took the county voting data from all 50 states county results one by one, then one by one resized each state and combined them into one full United States map.
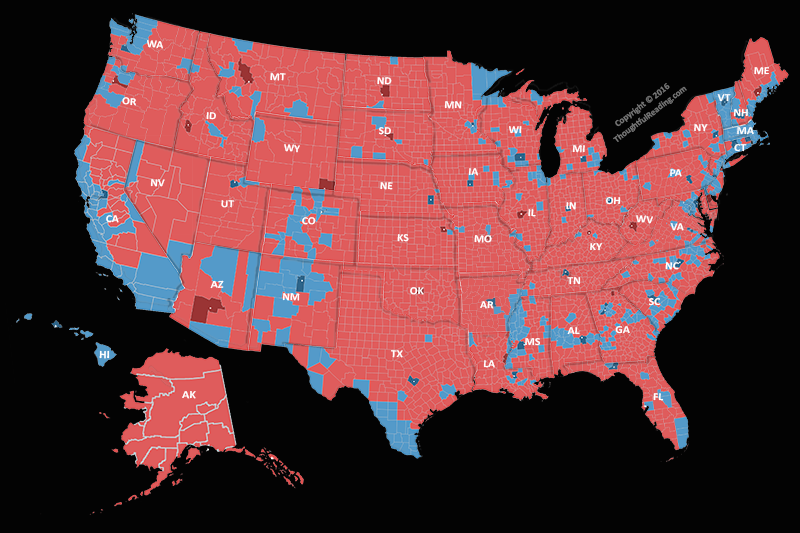
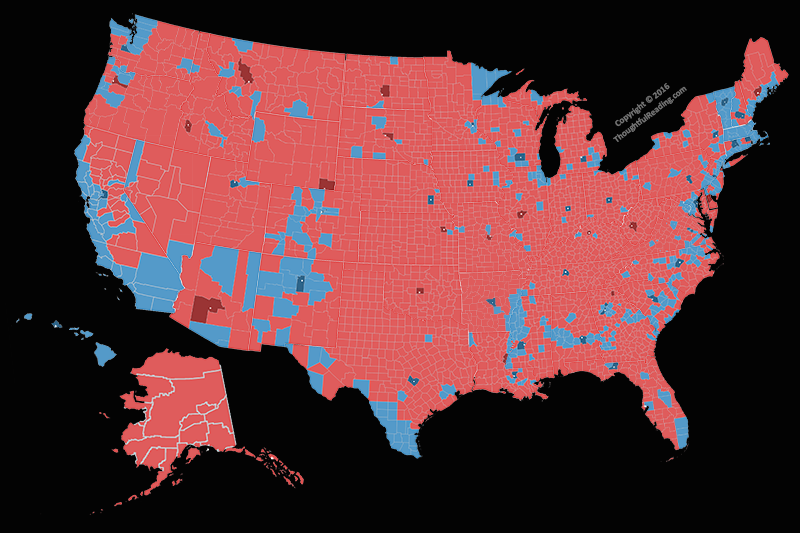
The Red is republican and indicates the majority of the county voted for Donald Trump. The Blue is for Democrat and indicates the majority of those couple counties voted for Hillary Clinton.
Click on the image for full size. Please be aware the full size image is very very large.
This red blue map is for Republican and Democrat, Trump and Hillary. It is clear from the map that almost the whole country voted for Trump, except for California, New Mexico, south Texas, and south Florida, which are all well known to have extremely high populations of illegal immigrants. These areas have upwards of 70% of the population of illegal immigrants, with some areas as much as 90% or more illegal immigrants, mostly from Mexico.
The other two exceptions are the deep inner cities of the South [SouthEast], which contain the next-highest populations of welfare recipients (areas with the highest illegal population, especially southern California, have the highest levels of welfare recipients). You will also note that these areas in the deep South [South East] that voted Democrat also have the highest populations of Africans in the United States.
Here I have also made a version with labels and outlines for the states so that you can see which states voted for what.

Now, you might be wondering, what about New England? You will notice that New Hampshire voted Republican, but Vermont was one of the bluest states. Vermont has an extreme crime and illegal problem, due to bordering Canada and Montreal. That area of Canada is an entry place for illegals and America-hating people from Africa and the Middle East.
You will notice in Vermont that the blue bleeds from the Vermont-Canada border and floods down and out. The pathway for non-Americans up in New England is very clear. Check out this article for more: Criminals Are Flooding Vermont to Trade Guns for Heroin. Additionally, Vermont and Maine are the only states in the entire country that allow felons (criminals with a felony conviction) to vote. This includes criminals currently in prison. That should be telling when looking at Vermont’s blue-ness.
Also see Vermont’s New Immigration Policy where in 2011 liberals said they passed laws to turn a blind eye toward illegal immigration in Vermont. Essentially, Vermont has become a safe haven for illegals flooding in from across the ocean and entering through Montreal, Canada; as well as a safe haven for illegal Mexicans flooding up from the south.
You will also notice the bottom corner of New York, as in Manhattan, which is blue; yet New York has the third-highest rates of illegal immigration. It seems from the map that the illegals are flooding down through Vermont, and also through airports in New York City.
What about up in the Pacific Northwest? Seattle has one of the highest Asian populations, with the exception of course of California. The ports of Seattle is a popular entry place for illegal Asians to come on a short or extended visa, then let it lapse and continue to live in the United States indefinitely. They also come on a student visa to study and then once graduating let their visa lapse and remain in the US.
There is a similar problem is the San Francisco area in northern California, as well as the Los Angeles area in southern California. Of course, southern California is also flooded with illegal Mexicans from the south.
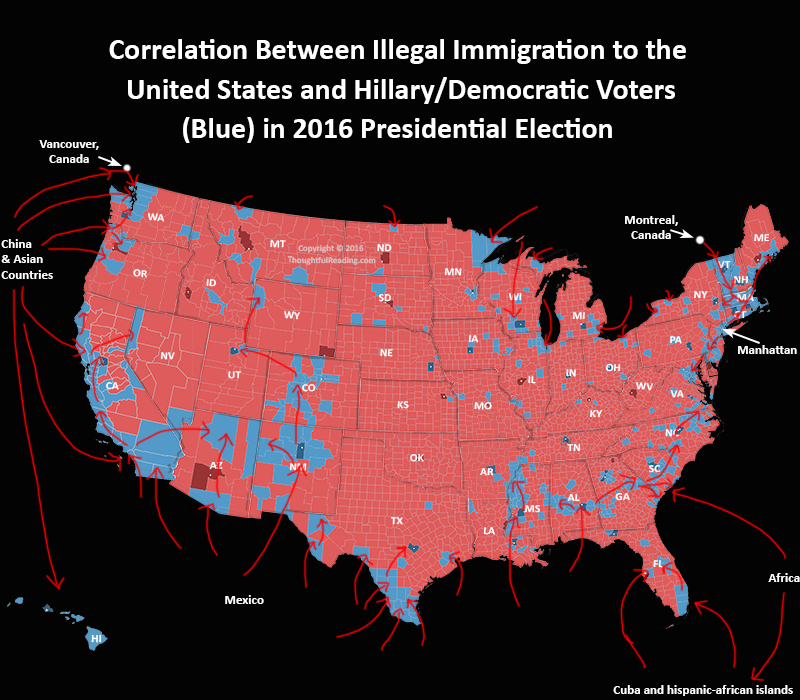
Also check out this map where I show the flow of illegal immigrants. You can clearly see the correlation between counties voting democrat and immigrant (non-American) populations.

and Hillary / Democratic Voters (Blue) in 2016 Presidential Election
It is definitely telling that the areas further from the borders where immigrants can come in, that is, the central midwest, has the lowest rates of democratic voters and the highest rates of Trump voters. These are the areas shielded from the oceans and borders by land, for it is not practical for immigrants, especially illegals, to travel thousands of miles into the central United States, when they can leech off the liberal cities near the borders where they arrived.
It is very clear here that almost all of the real Americans voted for Trump. People are getting fed up with the tyranny of liberalism, and are afraid of what Hillary promised to do – which was to flood America with tens of millions of more America-hating immigrants.
On the flip side, Trump promised to put a halt to the illegal immigration crisis, build a wall between Mexico and the United States, and deport millions of illegals.
It is clear what Americans want – and what we want is a real country with closed borders. The people voting for Hillary – and most probably not voting legally – want the opposite. They hate America and want to destroy it, and knew that Hillary would spell the end for America.
Fortunately, the American People prevailed this election, and with Trump in office in just a few months now that he has won the election, America can begin to heal from the wounds of the socialist democrats.


Good job and commentary.
Interesting comments about “Vermont has an extreme crime and illegal problem.” We’re currently the #1 safest state in the country when it comes to crime and in the top 10 for the last I don’t know how many years.Should I assume feelings and speculation are more important than facts?
Not so fast, actually Vermont is mostly forest, so although it is often ranked number 1, actually that only counts if you plan on living in the middle of the forest where there are no people. Actually, there is a lot of crime in Vermont, many people may not realize when they are looking at a ranking chart.
See crime in Rutland, Vermont, for example. Rutland is more dangerous than 67% of the cities in the United States. In Rutland you have a 1 in 34 chance of becoming a victim of any crime. The overall crime rate in Rutland is 4% higher than the national average. http://www.areavibes.com/rutland-vt/livability/?ll=43.60967+-72.97779
See this, New England town ripped apart by heroin http://america.aljazeera.com/watch/shows/america-tonight/america-tonight-blog/2014/3/12/new-england-townrippedapartbyheroin.html
See this: These Are The 10 Most Dangerous Cities In Vermont https://www.roadsnacks.net/most-dangerous-cities-in-vermont/
Quote: “how much crime can there be in a state that’s 75% forest? Not much, but that doesn’t mean that some cities have a heckuva lot more crime than others.”
It seems the data is skewed because most states aren’t 75% uninhabited.
As far as the really bad illegal immigration problem, I guess you didn’t read the links I posted. http://www.occidentaldissent.com/2011/11/06/vermonts-new-immigration-policy/
It’s got so bad that officials have turned a blind eye to the severe illegal immigration problem in Vermont.
Hey I also found this. Vermont is also #1 for the worst drug problems in the country (Heroin). http://www.slate.com/blogs/business_insider/2013/10/13/the_state_with_the_biggest_drug_problem_it_s_vermont.html
Quote: “Vermont has the highest rate of illicit drug use in the country with 15% of people saying they’ve used within the past month (compared to 4.2% in Utah, where drug use is the lowest), according to 2010-2011 surveys from the Substance Abuse and Mental Health Services Administration. The state ranked high for almost every type of drug, from marijuana to cocaine.”
Would love to see this updated with the final numbers.
It was done after the election concluded, it is near exactly the current numbers. The picture wouldn’t change at all.